Section 2 An analysis of forest clearances
Vijay Ramesh1*, Pratik Rajan Gupte2, Mridula Mary Paul3
1*Department of Ecology, Evolution and Environmental Biology, Columbia University, New York, NY 10027
2Groningen Institute for Evolutionary Life Sciences, University of Groningen, Groningen 9747 AG, The Netherlands
3Ashoka Trust for Research in Ecology and the Environment, Jakkur Post, Bengaluru 560064, India
4Department of Aerospace Engineering, Indian Institute of Science, Bengaluru, 560012, India
2.1 Load data
Data is accessed from the PARIVESH portal.
2.1.1 Pre-2014 data
## read in the data prior to 2014
pre_2014 <- read_csv("Data/forest_clearance/for_clear_before_2014.csv")
## Parsed with column specification:
## cols(
## ID = col_double(),
## PROPOSAL_NO = col_character(),
## USER_ID = col_character(),
## PROPOSAL_NAME = col_character(),
## CATEGORY = col_character(),
## USER_AGENCY_NAME = col_character(),
## AREA_APPLIED = col_double(),
## DATE_FROM_UA_TO_NODAL = col_character(),
## STATE_NAME = col_character(),
## PROPOSAL_STATUS = col_character(),
## PROPOSAL_STATUS1 = col_character(),
## RESTATUS = col_character()
## )2.1.2 Post-2014 data
We do not consider lease renewals in our analysis. This is a simple way to avoid double counting.
# get the same data for post 2014 period
post_2014 <- list.files("Data/forest_clearance/",
                        pattern = "after_2014",
                        full.names = TRUE) %>%
  str_subset("Renew", negate = T)
post_2014 <- map(post_2014, read_csv)
## Parsed with column specification:
## cols(
## id = col_double(),
## state_name = col_character(),
## Proposal_no = col_character(),
## Onlineuserid = col_double(),
## user_id = col_character(),
## Proposal_Name = col_character(),
## category = col_character(),
## user_agency_name = col_character(),
## area_applied = col_double(),
## date_from_ua_to_nodal = col_character(),
## proposal_status = col_character(),
## date_of_recomm = col_character(),
## Undersection_Act = col_character()
## )## Parsed with column specification:
## cols(
## id = col_double(),
## Proposal_no = col_character(),
## user_id = col_double(),
## Moef_file_no = col_character(),
## Proposal_Name = col_character(),
## category = col_character(),
## user_agency_name = col_character(),
## area_applied = col_double(),
## date_from_ua_to_nodal = col_character(),
## State_Name = col_character(),
## proposal_status = col_character(),
## date_of_recomm = col_character(),
## user_id1 = col_double()
## )## Parsed with column specification:
## cols(
## id = col_double(),
## state_name = col_character(),
## Proposal_no = col_character(),
## Onlineuserid = col_double(),
## user_id = col_character(),
## Proposal_Name = col_character(),
## category = col_character(),
## user_agency_name = col_character(),
## area_applied = col_double(),
## date_from_ua_to_nodal = col_character(),
## proposal_status = col_character(),
## date_of_recomm = col_character()
## )2.2 Basic analyses
2.2.1 Getting the status of applications
# get broader categories
forest_data <- forest_data %>%
  mutate(status = case_when(
    str_detect(proposal_status,
               regex("(PENDING|RETURNED|SECRETARY|COMPLIANCE|Under examination|Draft)",
                     ignore_case = TRUE)) ~
      "pending",
    str_detect(proposal_status, regex("APPROVED|IN-PRINCIPLE",
                                      ignore_case = TRUE)) ~
      "successful",
    str_detect(proposal_status, regex("REJECTED|REVOKED|WITHDRAWN|CLOSED",
                                      ignore_case = TRUE)) ~
      "unsuccessful",
    T ~ "other"
  ))

# get period
forest_data <- forest_data %>%
  filter(year < 2020) %>%
  mutate(period = case_when(
    year < 2006 ~ "2000 - 2005",
    year >= 2006 & year < 2014 ~ "2006 - 2013",
    year >= 2014 ~ "2014 - 2019",
    T ~ NA_character_
  )) %>%
  drop_na(period)

# relevel factors
forest_data <- forest_data %>%
  mutate(status = forcats::fct_relevel(status,
                                       "successful",
                                       "pending",
                                       "unsuccessful",
                                       "other"))

# remove duplicate user ids
2.2.2 Area applied for over years
  ggplot() +
  geom_vline(xintercept = c(c(1994, 2006, 2014)),
             col = "indianred", size = 0.2,
             lty = c(1, 1, 3)) +
  stat_count(data = forest_data %>%
               filter(!status %in% "other"),
               aes(x = year, fill = status,
                   weight = area_applied * 0.01),
             # width = 0.75,
             size = 0.1,
             geom = "bar",
             position = "stack",
             col = "grey30") +
  annotate("text",
           x = c(1994, 2006, 2014)-c(0.5),
           y = 4500,
           size = 2.5,
           label = c("EIA Notification issued",
                     "EIA Notification amended",
                     "MoEFCC database changes"),
           col = c("grey20", "grey20", "grey80"),
           angle = 90) +
  scale_x_continuous(guide = guide_axis(n.dodge = 2),
                   label = str_to_title,
                   breaks = 1994:2019)+
  scale_y_continuous(labels = scales::comma_format(suffix = " sq. km."),
                     breaks = seq(2,6,2)*1e3) +
  scale_fill_scico_d(palette = "vik",
                     begin = 0.3, end = 0.7,
                     direction = 1,
                     name = "Proposal status",
                     labels = c("Successful", "Pending", "Unsuccessful")) +
  theme_test(base_family = "IBM Plex Sans",
             base_size = 8)+
  theme(legend.position = c(0.2,0.85),
        axis.text.y = element_text(angle = 90,
                                   hjust = 0.5),
        axis.text.x = element_text(size = 5),
        panel.grid.major.y = element_line(size = 0.1,
                                          colour = "grey"),
        panel.grid.minor.y = element_line(size = 0.1,
                                          colour = "grey"))+
  # facet_grid(~period, scales = "free_x") +
  coord_cartesian(xlim = c(1993, 2020),
                  ylim = c(0, 7000),
                  expand = F) +
  labs(x = "Year of proposal",
       y = "Forest area proposed to be cleared")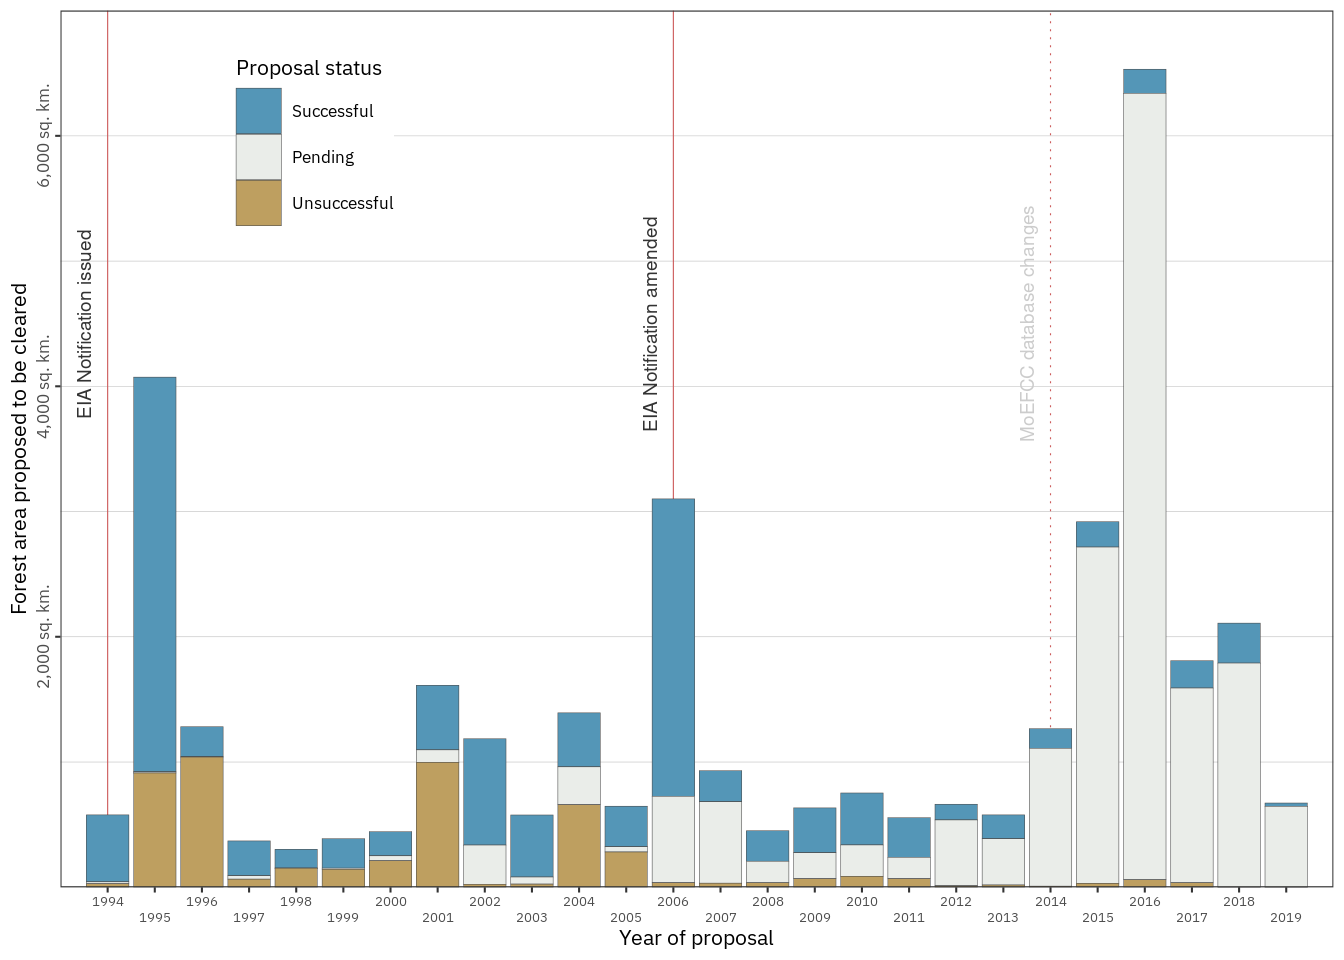
Figure 2.1: Forest area (in sq. km.) proposed for clearance over the years 1994 – 2019, coloured to show the fraction approved (blue), rejected (brown), and pending decision (grey). Projects applied for nearly twice as much area to be cleared in years when or shortly after a new EIA notification was adopted (1995 and 2006), as in other years. Since the approval rate did not differ significantly among years, 1995 and 2006 saw 814% more forest clearances approved than other years.
2.3 Rule change years and other years
2.3.1 Prepare data for models
data_rule_change <- forest_data %>%
  group_by(year, period) %>%
  summarise(total_area = sum(area_applied),
            proportion_approved = length(status[status == "successful"])
            / length(status)) %>%
  mutate(event = if_else(year %in% c(1995, 2006),
                         "rule change", "other"))
## `summarise()` regrouping output by 'year' (override with `.groups` argument)2.3.2 Area in relation to rule change
# fit a simple linear model for area
# quasipoisson for overdispersion
model_area <- glm(total_area ~ event,
   data = data_rule_change,
   family = "quasipoisson")

# print model summary
summary(model_area)
##
## Call:
## glm(formula = total_area ~ event, family = "quasipoisson", data = data_rule_change)
##
## Deviance Residuals:
## Min 1Q Median 3Q Max
## -309.63 -199.01 -146.08 47.31 1072.18
##
## Coefficients:
## Estimate Std. Error t value Pr(>|t|)
## (Intercept) 11.6931 0.2179 53.66 <2e-16 ***
## eventrule change 1.0972 0.4875 2.25 0.0339 *
## ---
## Signif. codes: 0 '***' 0.001 '**' 0.01 '*' 0.05 '.' 0.1 ' ' 1
##
## (Dispersion parameter for quasipoisson family taken to be 136467.7)
##
## Null deviance: 2657597 on 25 degrees of freedom
## Residual deviance: 2109080 on 24 degrees of freedom
## AIC: NA
##
## Number of Fisher Scoring iterations: 5# print means and sd
data_area_summary <- group_by(data_rule_change, event) %>%
mutate(total_area_km = total_area * 0.01) %>%
summarise_at(vars("total_area_km"), .funs = list(mean_area = mean,
sd_area = sd))
data_area_summary %>%
knitr::kable()| event | mean_area | sd_area |
|---|---|---|
| other | 1197.466 | 1303.2068 |
| rule change | 3587.178 | 687.2126 |
# print % difference relative to normal years
abs(diff(data_area_summary$mean_area)) / min(data_area_summary$mean_area)
## [1] 1.99564In years in which EIA rules were changed (1995 and 2006), applications are made to clear 200% more forest land than in other years.
2.3.3 Area approved in relation to rule change
# summarise the data and print
data_area_approved <-
forest_data %>%
  filter(status == "successful") %>%
  group_by(year) %>%
  summarise(total_area = sum(area_applied)) %>%
  mutate(event = if_else(year %in% c(1995, 2006),
                         "rule change", "other"))
## `summarise()` ungrouping output (override with `.groups` argument)# fit a simple linear model for area approved
# quasipoisson for overdispersion
model_area_approved <- glm(total_area ~ event,
data = data_area_approved,
family = "quasipoisson")
# print model summary
summary(model_area_approved)##
## Call:
## glm(formula = total_area ~ event, family = "quasipoisson", data = data_area_approved)
##
## Deviance Residuals:
## Min 1Q Median 3Q Max
## -205.34 -67.68 -33.48 53.50 256.72
##
## Coefficients:
## Estimate Std. Error t value Pr(>|t|)
## (Intercept) 10.3169 0.1171 88.13 < 2e-16 ***
## eventrule change 2.2122 0.1781 12.42 6.07e-12 ***
## ---
## Signif. codes: 0 '***' 0.001 '**' 0.01 '*' 0.05 '.' 0.1 ' ' 1
##
## (Dispersion parameter for quasipoisson family taken to be 9946.432)
##
## Null deviance: 1425074 on 25 degrees of freedom
## Residual deviance: 223003 on 24 degrees of freedom
## AIC: NA
##
## Number of Fisher Scoring iterations: 4# print table
data_area_approved_summary <- data_area_approved %>%
mutate(total_area_km = total_area * 0.01) %>%
group_by(event) %>%
summarise_at(vars("total_area_km"), .funs = list(mean_area = mean,
sd_area = sd))
data_area_approved_summary %>%
knitr::kable()| event | mean_area | sd_area |
|---|---|---|
| other | 302.4002 | 173.0824 |
| rule change | 2762.6557 | 547.5280 |
In years in which EIA rules were changed (1995 and 2006), 814% more forest land was approved for clearance than in other years.
2.3.4 Proportion of success in relation to rule change
# add time to present as a linear predictor
data_rule_change <- data_rule_change %>%
  mutate(time_to_present = 2020 - year)

# fit a simple glm with binomial family
model_approval <- glm(proportion_approved ~ event +
                        time_to_present,
                      data = data_rule_change,
                      family = "binomial")
## Warning in eval(family$initialize): non-integer #successes in a binomial glm!##
## Call:
## glm(formula = proportion_approved ~ event + time_to_present,
## family = "binomial", data = data_rule_change)
##
## Deviance Residuals:
## Min 1Q Median 3Q Max
## -0.41500 -0.18068 -0.05278 0.21090 0.38848
##
## Coefficients:
## Estimate Std. Error z value Pr(>|z|)
## (Intercept) -0.49830 0.84153 -0.592 0.554
## eventrule change -0.03236 1.72964 -0.019 0.985
## time_to_present 0.08115 0.06037 1.344 0.179
##
## (Dispersion parameter for binomial family taken to be 1)
##
## Null deviance: 3.4509 on 25 degrees of freedom
## Residual deviance: 1.4007 on 23 degrees of freedom
## AIC: 28.866
##
## Number of Fisher Scoring iterations: 42.4 Land applied for clearance post 2014
# how much area on average applied for before and after 2014
area_by_2014 <- forest_data %>%
  mutate(period = ifelse(year < 2014, "pre-2014", "post-2014")) %>%
  group_by(year, period) %>%
  summarise(area_applied = sum(area_applied)) %>%
  group_by(period) %>%
  summarise_at(vars(area_applied), list(mean_area_per_year = mean))
## `summarise()` regrouping output by 'year' (override with `.groups` argument)| period | mean_area_per_year |
|---|---|
| post-2014 | 255279.3 |
| pre-2014 | 102984.0 |
2.5 Estimate forest clearance post 2014
2.5.1 Proportion of forest area approved pre-2014
Here, we look at the proportion of forest area successfully applied to be cleared. We disregard “pending” applications as their outcome is unknown.
# how much land area was successful as a proportion of decided proposals
prop_area_approved_pre2014 <- forest_data %>%
  filter(year < 2014) %>%
  summarise(prop_area_approved_pre_2014 = sum(area_applied[status == "successful"]) /
              sum(area_applied[status %in% c("successful", "unsuccessful")]))

# total area approved for clearance
total_area_approved_pre2014 <- forest_data %>%
  filter(year < 2014, status == "unsuccessful") %>%
  .$area_applied %>%
  sum(.)

# in sq km
total_area_approved_pre2014 <- total_area_approved_pre2014 * 0.01
Prior to 2014, 4902.7711623 sq.km. or 70% of forest area proposed to be cleared was actually approved for clearance.
2.5.2 Total area potentially approved for clearance post 2014
We apply the approval rate of 70% to pending proposals made after 2014, to get a rough estimate of forest area that will potentially be approved for clearance.
# get the approval rate
approval_rate_pre_2014 <- prop_area_approved_pre2014$prop_area_approved_pre_2014

# what area in sq km may be approved assuming a pre 2014 approval?
# requires a hectares to sq km conversion
area_cleared_post_2014 <- forest_data %>%
  filter(year >= 2014,
         status == "pending") %>%
  summarise(area_potentially_cleared = sum(area_applied) *
              approval_rate_pre_2014 * 0.01)
2.5.3 Projected clearances in relation to pre-2014 clearances
# how much more than pre 2014 approved clearances are the projected
# post 2014 clearances?
area_cleared_post_2014$area_potentially_cleared / total_area_approved_pre2014
## [1] 2.018461Assuming a pre-2014 clearance rate, 9,896 square kilometres are likely to be approved for clearance from post-2014 proposals alone. These projected clearances by themselves represent an increase of 202% over all approved clearances in the 20 years preceding 2014. Combined with the area already approved for clearance, this is cause for alarm.